CALIBRATING MONITORS IN THE NETWORK
Mandić, L.; Agić, D. & Strgar Kurečić, M.
Abstract: In a network, it is necessary that the colors displaed on all monitors look as alike as possible Multiple monitors can be calibrated to each other by saving target values (white point, gamma, luminance) of a reference monitor as reference values on a server and setting these as the target values for all other monitors. The basic architecture of a color management includes device profiles that communicate device characteristics to the color management module. The aim of this research was to find out is the device profile the best choice in image reproduction.
Key words: color management, device profile, device gamut, color, image reproduction
1. INTRODUCTION
Monitor is the window to the world of digital color. Monitor profiles-or more accurately, display profiles-are key to the big payoff of color management: the instantaneous preview of all color-managed materials (Giorgianni, 1998). Good monitor calibration and profiling is very important in digital image processing (Vrhel, 1999). The cathode ray tube (CRT) monitors are still lead in monitor display. A cathode ray is a stream of electrons that are fired from one end of an enclosed glass tube to the other. The electrons originate from electron guns that spray a beam of electrons onto the inside face of the tube, which is coated with phosphors-chemical compounds that kick off photons (light) of specific wavelengths when they`re struck by electrons. Color monitors use three phosphors in the mixture coating inside of the CRT (red, green and blue). The voltages sent from the video card control the bursts of electrons from the electron gun, and hence the amount of light emitted by the phosphors. Every CRT has controls for contrast and brightness (which really control white luminance and black luminance respectively). Most offer some degree of control over the color of white, either as a series of presets, as a continuously variable control, or as separate gain controls for the red, green and blue channels (Fraser,2005).
Building display profiles is a process of comparing known values with measured ones-in this case, the profiling software displays a series of color patches with known RGB values, and compares them with measurements from a colorimeter or spectrophotometer. There are two ways to change the behavior of a display, by adjusting the controls on the monitor itself, or by adjusting the signals that get sent to the monitor by tweaking the values in the video card's lookup table (LUT). The only way to adjust the display gamma is in the video LUT. It is important that the device profile represents the behavior of display as accurately as possible, attempting to make all monitors behave identically by calibrating them to the same white point and gamma. The white point of the monitor plays an important role for eye, that judges all colors relative to some neutral baseline that it considers white. The recommendation is to calibrate monitor to 6500 K (D65). The recommended setting for gamma depends somewhat on how much work is done outside the color-management environment. Without color management, the general practice has been to choose a gamma that best simulated the mid-tone characteristics of the target medium. Displays characteristics are determined by two main factors: the light-emitting phosphors and the display gamma. The display gamma is actually the product of two separate components: the gammas of the display hardware (or CRT), and the frame buffer lookup tables (LUT) of the host computer [ 2 ] . CRT gamma is quite consistent between different devices. The great majority of CRTs are manufactured with a gamma of 2.2 with relatively variation between them. The frame buffer LUT is the main source of variation in display gamma and tends to vary between different platforms: the Macintosh has a LUT gamma of 1.4, the PC usually 1.0 (Green, 1999). The Gamma Value represents the progressive gradations across the color scale. Normally monitors are set to flatter gradation curves in lighter image areas and steeper gradation curves in darker image areas. On the Apple Macintosh platform the monitor gamma is typically set to 1.8, while PC systems require a setting of 2.2.
2. EXPERIMENT
Two non calibrated CRT monitors, Apple and Mitsubishi 21 inch, were included in experiment. For monitor calibration Profile Maker 4.1 software was used, and color measurements were performed using Gretag Spectrolino photometer. The test-chart with 42 color patches is shown in figure 1(Mandić, 2000)
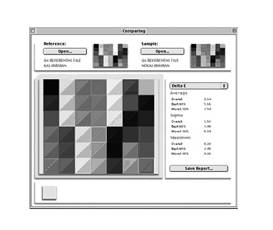
Figure 1. CRT test chart
MeasureTool in ProfileMaker calibrates monitors in three steps. Contrast and brightness are first adjusted using a measurement device. The measuring device measured two slightly different white fields one after the other. If the difference in brightness measured between the two fields is big enough, the contrast is optimal. The optimal brightness setting is achieved if the black value of the monitor still shows a dark black as neutrally as possible but gradings can be identified in dark areas of images. Manual calibration is used to adjust the hardware color temperature (6500K) or RGB phosphors. Lastly an automatic calibration is performed, calculates the adjustment curves and stores them in video card. If the reference monitor is to be recalibrated and the reference value file updated on the server, the changes can be applied to all other monitors using a simple update function. A reference monitor was Apple, and that reference values were the target values (Mandić, 2001).
3. RESULTS
Results are presented in table 1, and figure 2 and 3. In table 1 are shown colorimetric differences ( ΔE ) and differences in lightness ( ΔL), chroma ( ΔC) and hue ( ΔH) between two monitors, for all color patches of test charts.
Table 1. Data for test chart

Figure 2. Monitor characteristics before and after calibration
Figure 3. Differences between two monitors
4. DISCUSSION
Measurement of CRT monitor was achieved on 42 test patches, and data was written in form of data base for 36 wavelength intervals. Calibrated monitor will show primary colors with the highest colorfulness (chroma), available by hardware, and with obtained balance. Calibrated monitors are able to show more colors than monitors that are not calibrated. The difference between different monitors is mainly in luminance. This is due to monitor aging. In the case where Mitsubishi monitor was chosen as reference monitor, the image appearance on monitors were not similar. The similar image appearance was obtained in the case where Apple monitor was the reference one, but the gamut was smaller.
5. CONCLUSION
The aim of this experiment was to investigate the accurate color appearance on CRT monitors that are connected in network. It is desirable to calibrate each monitor in network, and ensure the maximal gamut. The purpose of analysis of measurement data was to find out which monitor will be set as reference monitor.
The results were good if all monitors in network are the same age and quality. Otherwise, the reference monitor is the one with worse characteristic. The best results will be obtained with control of ambient`s parameter, and such system will be appropriate and give constant results if the monitors calibrate once in week.
6. REFERENCES
Fraser, B.; Murphy, C.; Bunting, F. (2005). Color
Management, Second Edition , 0-321-26722-2, Peachpit Press, Berkeley
Giorgianni, E.; Madden, T. (1998). Digital Color
Management, Addison-Wesley, 0-201-63426-0,
Reading , Massachusetts
Green, P. (1999). Understanding Digital Color, Pira
International, 1-85802-450-1, Pittsburg
International Color Consortium, ICC Profile Format
Specification, Version 3. 3.1996 ( http://www.color.org )
Mortimer, A. (1998). Color Reproduction in a Digital Age, Pira
International, 1-85802-278-9, Surrey
Mandić, L., Agić D. & Gojo M. (2000) The Importance of Device Calibration in Color Management Proceedings of the 11 th DAAAM Symposium, Katalinić, B. (Ed.) pp289-290, 3-901509-13-5, Opatija, October 2000, DAAAM International Vienna, Vienna
Mandić, L., Grgić, S. & Grgić M. (2001) Monitor Calibration and Colour Management Proceedings, of 8 th International Workshop on Systems, Signals and Image Processing / Cristea, P. ; Tuduce, R. ; Negrescu, S. (Ed)
Pp 87-90, IWSSIP 2001, Bucharest , June 2001
Vrhel, M.J.; Trussel, H.J. Color device Calibration: A Mathematical Formulation, IEEE Transactions on Image
Processing, Vol.8, No. 12 , December 1999.