International conference on Computer Aided Design and Manufacturing CADAM'05.
INFORMATION TRANSFORMATION IN THE PROCESS OF COMPRESSION OF THE DIGITAL IMAGE DATA
Nježić, Z.; Žiljak, V.; Strgar Kurečić, M.
Abstract: Important changes in image file appear in contracting the images. The aim of our investigations was to introduce and suggest the quantitative methods of evaluation of compression and decompression value of image files prepared for printing. The values of the pixel density and its changes in multilayer file transition flow tiff/jpg/tiff have been compared. The usual qualitative evaluation values, based on the subjective experience of the image quality are insecure. The results of this work have practical application in the filed of graphic engineering in the analysis of the print realized with the compressed file.
Keywords: compressed image file, progressive jpeg, image element
1 INTRODUCTION
Insufficient analysis of the difference of the image elements within the non compressed image file in relation to the compressed image file caused this investigation. The intention was to evaluate objectively the obvious vivid subjective difference of the transformed file and to determine quantitatively the obtained results. The real change of the information which appears during compression was determined by comparison of unit parts of the original with the transformed file. Manifold successive compression of the image file was performed during measurement in order to determine the factor of the image element change. Different grade of compression was applied on the original file to find out the change in the file size with the real change of information. The analysis was done based on the calculation of the difference in information of two pixels, whose position is identical in the original and the transformed compressed file. The sum of the tone difference of the comparative file, medium of these values, standard deviation and belonging absolute values were determined. Sequences of 35 unit elements with the depth of 8 bits per pixel of the grey file using the progressive jpeg of compression with the belonging ten gradations were used in investigation. The intention was to prove that the new change caused by the compression on the image file shows deviation from the original file and that this change is quantitative measurable. With the obtained results it is also possible to evaluate qualitatively new states of the file such as tonal change (if the file is lighter or darker) as well as the total tonal change.
2 ANALYSIS OF THE IMAGE FILE CONTENT CAUSED BY COMPRESSION
The investigation was directed to the image file with equal representation of all the tone elements, which can be seen from the presented tone distribution and from the original file in hexadecimal form Fig. 1. A series of file sequences with the determined real change of unit element value has been presented further on. The upper row in sequence files represents the beginning of the image and the lower row represents the transformed code of the image. The first and the second column represent the decimal value of the file, the third one is the difference in values of the starting sequence and the transforming sequence and the fourth one is the absolute difference in sequences.
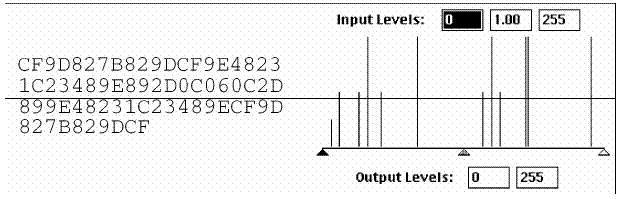
Fig. 1. Image file with equal representation of tone elements
The first horizontal row presents the hexadecimal file of the non-transformed sequence Fig. 2. which is compared with the transformed hexadecimal file of the sequence obtained by the determined compression grade Fig. 3.

Fig. 2. Hexadecimal file of non-transformed sequence
The difference calculation among the equally positioned unit elements of the both sequences has been found out and the change on the transformed image has been proved. For the lower horizontal hexadecimal file, the visual presentation of the sequences marked by particular tones has been given.

Fig. 3. Hexadecimal file of transformed sequence
During the investigation the method of progressive jpeg with all the compression grades has been used. The first step referred to the lowest compression grade which has been proved with the absolute sum (sum ABS) by the change in the difference of the identical positioned pixels. On both figures (figure b and figure Fig. 4.) the pixel has been marked which changed the value in the first grade from CF into CE (darkened for one level of grey, Fig. 3.) and in the second grade from CF into D1 (darkening for two levels of grade, Fig. 4.).

Fig. 4. Hexadecimal file of transformed sequence
In the third grade, the difference in relation to the original file has been measured for two i.e. three levels of grey in the sense of darkening for the marked pixels (Fig. 5.). 9D has been transformed into 9B, and CF into CC. In the compression process itself, there were no information changes of all unit elements. This supposition is proved by the fact that particular pixels which retained identical level of grey have been located, e.g. single elements have been separated marked by 48 and 1C (Fig. 5.). The conclusion made from out of that presentation is that the original pixel 9D changed the information for 0.781875% and CF for 1.171875%, and the fourth degree of compression. The transformed unit elements 98 and D3 (Fig. 6.) have been marked for the fourth degree of compression.

Fig. 5. Hexadecimal file of transformed sequence
Four equal positions from the figure d have been marked for comparison of the tone change analysis. In relation to the original file 9D has changed into 98 (the change in relation to the original pixel is 1.953125), and CF into D3 (the change in relation to the original pixel is 1.563). The added pixel with the value 98(Fig. 6.) is darkened for five levels, and D3 is brightened for 4 levels.

Fig. 6. Hexadecimal file of transformed sequence
Comparing the differences between the third and the fourth grade for the marked pixels, one can conclude that in both cases there was darkening of unit elements for three levels that is for seven levels of grey. The calculated value with the sum determines the darkening level, i.e. the brightening level in the numerical value of the total image surface after compression. The greatest degree of compression of the progressive jpeg with the medium ABS=9 determines the average change of 9 levels of grey for each unit element (the results of all six degrees are presented in graphs). Extremely great transformations in the sense of values have been measured for particular pixels, so the original element 82 has been transformed into 6E (the change is 7.8125% that is 20 levels of grey), 82 into 69 (the change is 9.765% that is 25 levels of grey), 2D into 42 (the change is 8.2031% that is 21 levels of grey). This analysis proves that higher degrees of compression cause higher information transformation within the file. With the highest degree, the sum ABS=315 has been measured, which defines the absolute change in relation to the original file in the value of 315 levels of grey, standard deviation = 11.094768 levels of grey (the change of the medium darkening of the unit element). It is stressed by the detailed processing of the image files that during the usage of the presented and processed compression form, explicitly great disturbance of original file information appears. In this way the danger of the total tone loss of the original unit element is stressed. Systematic and steady control in the whole digitalization process of the image file is suggested. However, the practice shows that just the human factor of the responsibility towards the work is decisive for qualitative performed work, and not the computer. Manifold opening and compression of the same file will result in undesirable effects which unfortunately cannot be corrected in further processes. The graphs with the description of the new situation for particular compression degree have been given further on.
2.1. Comparative result analysis of different tonal files
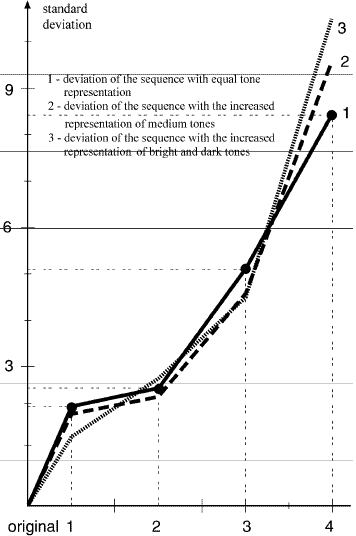
Graph 1. describes the change of the standard deviation in relation to the original, where three files with different tones representation have been chosen for analysis. Comparing these different files, one wanted to find out which of them will have the greatest change in darkening of the unit element. The first file was presented with equal representation of all the tones; that is of grey levels, the second file had greater representation of medium tones and the third one had the greater representation of bright and dark tones (with great contrast). The change of the standard deviation describes the average deviation of the particular unit element from the calculated medium value of all the pixels within the sequence. The given results of the standard deviation are presented in the numerical expression of the grey scale levels.
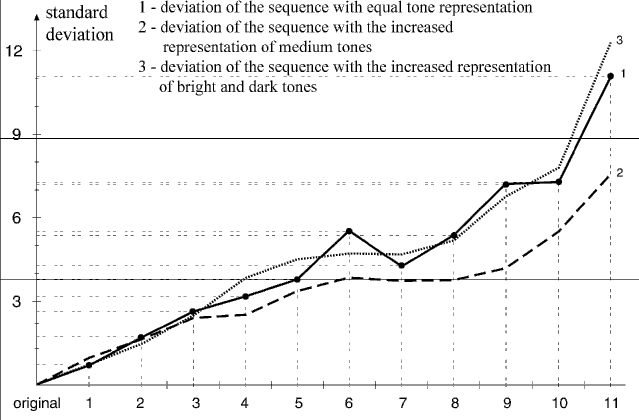
Graph 1. Changes of the standard deviation in dependence on compression sequences
Comparing the results of the three different files, one can conclude that the deviation gets approximately the same value up to the third compression series. The lowest average deviation per unit element can be seen on the file with the increased representation of the medium tones. The sequence with the increased quantity of bright and dark tones resulted in the series of compression with the greatest change of pixel darkening.
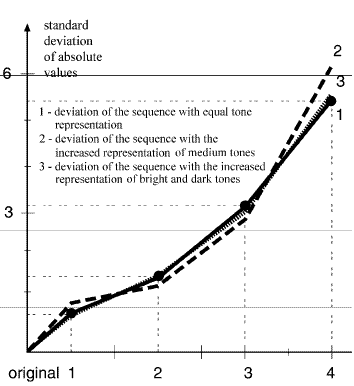
Graph 2. presents the change of the standard deviation of the absolute values for three files with different tone distribution. The obtained results of the standard deviation of the absolute values represent the numerical value of the medium change of the particular element from the average darkening of the unit element within the file. This numerical value is presented in the grey scale levels. Up to the sixth series of compression, the smallest deviation was seen on the file with the increased representation of the medium tones. By increasing the series of the successive compression one can conclude that the greatest medium change of pixels can be seen on the sequence with the increased representation of the bright and the dark tones. These results give the conclusion that it is necessary to make the analysis of the file before compression.
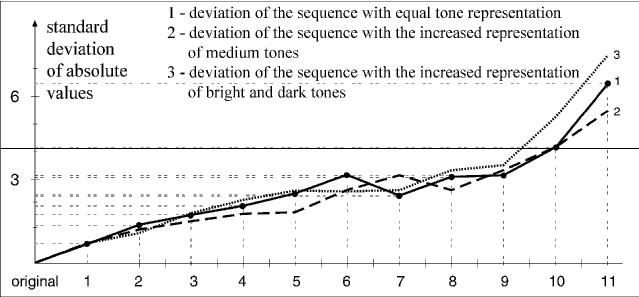
Graph 2. Changes of the standard deviation of the absolute values in dependence on compression sequences
Graph 3 describes the change of the medium absolute value of the unit elements in dependence of the different degrees of compression (in the interval from the smallest to the greatest parameter). The obtained numerical value represents the total absolute deformation per unit element in relation to the original. This is the only parameter comprising the new change on the file.
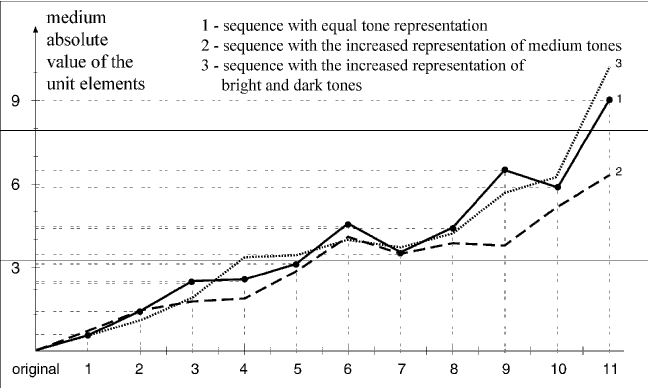
Graph 3. Changes of the absolute medium value of unit elements in dependence on compression sequences
From the analysis of the presented graph the supposition is proved that by the increase of the compression degree, greater absolute changes of the transformed file appear. This refers to all the three sequences with different contents. If the total absolute change for the transformed file has to be determined, it is necessary to multiply the result with the number of the unit elements contained in the image. This result represents the absolute change in the levels of grey. The possibility of the total information loss on the transformed file while inadequately used in the compression process is especially stressed. By calculating and determining the mentioned parameters it is possible to determine the real numerical change in information during the original transformation. It was found out that the greatest changes of information in relation to the original happen in the area of greater parameters of the progressive compression, which is described and analyzed in the graphs.
By the change of the middle values of the unit elements of the sequence it is possible to determine if the whole sequence will visually be darker or brighter after the transformation in relation to the original file. The medium value determines the average darkening or brightening per particular element so that the whole change is divided on pixel number which forms the sequence. The next parameter which was calculated was the change of the medium absolute value of the unit elements in relation to the different approach of compression (in intervals from the smallest to the greatest ones). The obtained numerical sum presents the total absolute deformation per particular element in relation to the original. This is the only parameter which comprises the total new change on the file.
Graph 4 presents the change of the middle value of unit sequence elements. By means of this parameter it is possible to determine if the total sequence will visually be darker or lighter after transformation in relation to the original record. The middle value denotes the average darkening or lightening per unit element so that the total change is divided in number of pixels composing the sequence.
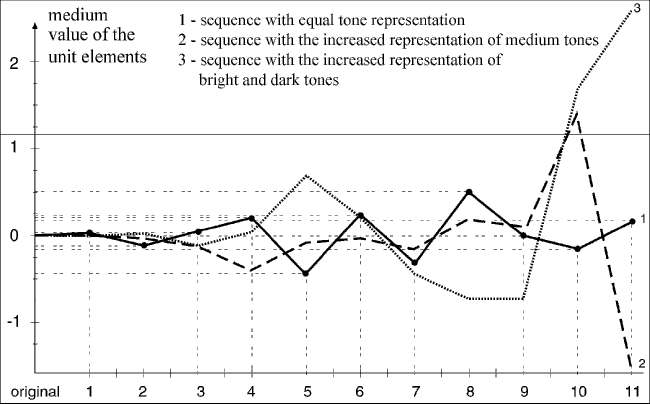
Graph 4. Changes of the medium value of unit elements in dependence on compression sequences
The expressive change happened on the fifth successive sequence on which the record with the equal representation of tones became darker, and in the following compression it became stable in the distance of -0.5 to 0.5. From the obtained numerical value, it is possible to determine the exact amount in percentage, for how much the transformed record has changed in tonality. The obtained value is multiplied by the number of the unit elements; this amount is put into relationship with the number of grey scale levels and the result is the percentage of the darkening change of the transformed record. It is interested that in the tenth and eleventh sequence of compression explicitly great changes happen in relation to the original for the record with the increased representation of the middle tones and the record with the increased representation of the lighter and darker tones (contrast sequence). These changes in tonality were greater than 20%. It is very important to control this value while usage because drastic changes can happen in comparison to the original image.
In addition there are the obtained results for pict record which processes the change of the standard deviation and the standard deviation of the absolute values by using all four compression levels within the pict record (graphs 5 and 6). It was found out that the smallest transformation of information was between the first and the second compression level and after the second level extremely great change of transformed record happened in relation to the original record. The numerical value of the standard deviation represents the middle change in levels of grey from the average darkening of the unit element.
Graph 5. Changes of the standard deviation in dependence on compression sequences
Graph 6. Changes of the standard deviation of the absolute values in dependence on compression sequences
Comparing the three tonally different records, it was estimated that the numerical changes were approximate (the change was from 1% to 3%). It can be concluded that the saved memory space was inconsiderable in dependence on the record type. Looking at the whole tonal record, and using the greatest compression level on the original record which has the increased representation of the lighter and darker tones, the change of 4% was measured in relation to the transformed record. With the same compression level on the transformed sequence with the equal representation of tones, the change of 3% was obtained. Comparing the greatest compression level in jpeg and pict forms it was found out that the progressive jpeg generated 205 to 25% greater deformation in the transformed record. Graph 6 describes the standard deviation of the absolute values in which the numerical value represents the middle change of particular element from the average darkening of the unit element within the record. During testing, the measurements were performed on sequences described in figure 1 because of the possibility of putting the obtained results in relation. From the obtained sum of the absolute values the total record deformation was determined .
3 CONCLUSION
The investigation proved that the new change on the image file which appeared caused by the compression shows the deviation from the original file. The new method of the quantitative evaluation of the irreversible transformation process tiff-jpeg-tiff has been suggested. The differences of the numerical values of the image elements darkening are evaluated by iteration by manifold usage of the image compression by the most present algorithms. The results of this investigation have important application in the area of graphic engineering, primarily in discussions about objective quality of prints realized with the compressed transformed file. Experimenting was directed to files with equal representation of lighter, medium and darker tones. Medium value of unit element determined the medium change of the total image and defined with it the changed visual presentation in relation to the original. Standard deviation determined the deviation in tonal levels of the original from the transformed file and in this way the real quantitative change was determined. The suggested process could be generalized as the method of evaluation of the compression algorithm and the decompression of the image files.
References:
[1] Foley, J.; Dam, A.; Feiner, S. & Hughes, J. (1991). Computer Graphics,
ISBN 0-201-84840-6, Addison-Wesley Publisher Company, New York
[2] Nježić, Z.; Žiljak, V. & Pap, K. (2002). Design of Digital Graphic System,
Proceedings of the 7th international design conference, Marjanović D. (Ed.),
ISBN 953-6313-47-9, Dubrovnik Author: Njezic Zoran, University of Graphic Arts,
Department for the prepress in printing and computer sciences,
Getaldiceva 2, Zagreb, Croatia, phone +385 1 237 1080, e-mail: znjezic@grf.hr