Abstract :
Developing and reproduction through the CTP systems bring out a number of novelties, even in the field of different screening methods. Today, the conventional screens (AM) are mostly used in the printing process. In certain types of reproduction the usage of frequently modulated screening method (FM) is becoming wider. In this paper the original was reproduced by using the AM and the FM screening method in the same CTP workflow, after which it was printed in offset. The differences in the quality of prints have been defined. For printing of characteristic motives different models and conditions of usage of certain types screening elements have been suggested. This kind of investigation will simplify the process of deciding which screening element will find use in the graphic reproduction. The proposed new screening method will correct the disadvantages of the investigated screens.
Key words: AM and FM screening methods, print quality.
1 Introduction
Most of the photographic images are printed using the same technique, called screening. It converts shades of gray into small black dots arranged on a grid. Different shades of gray are simulated by adjusting the dot size and the density of the grid according to the screening system. Today, there are many different screening methods which suit to the certain reproduction system. The amplitude-modulated (AM) screening method consists of dots of different sizes according to tone value, but at the constant distance from one another. In contrast, frequency modulated screening method (FM), places identical size dots in a random pattern to simulate a continuous tone image. While AM uses a straightforward, deterministic translation scheme (each input level of gray matches a corresponding dot size and position), FM employs mathematical uncertainties. Depending on the type of stochastic screening used, dots of ink can vary in size, frequency, or even shape. Dots are spaced irregularly at a frequency that depends on the image gray value. By enlarging the surface coverage the number of dots is being enlarged as well, to the point of touching or even folding over. The prints made by using the FM screening method are of color photography quality, gradients are more correctly defined and the trapping is better than the one with the AM screening method (Levien, 1995). The sharpness of details obtained by this method is impossible to reach by using any other screening methods. Because of this the usage of the FM screening in the technologically highly demanding reproductions is most frequently recommended in the literature. The development and the employment of FM screening was certainly quite a revolution in the digital printing. Based on the fact that a FM screening has a very good visual quality and is free from moiré or rosette, the prevailing assumption was that the FM screening would become increasingly widely used in the graphic arts industry (Wadle & Blum, 2002). In practice, however, the AM screening methods are still predominant. For the reason of some technical problems FM screening survives only in some packaging applications where six or more color printing is popular and screen clashes are to be avoided. The every day printing practice has shown that it is not possible to achieve the equal reproduction quality by printing the same original with a slight change in e.g. text, in the same workflow conditions (Ward, 2003). In spite of that, printing houses tend to use the FM screening technology more and more every day.
The screening methods are being improved by the development of the digital technologies (especially CTP). Prior to the transition to CTP platesetting, a printer's ability to hold dots in low-density areas was difficult. As CTP gained followers, FM screening also became more popular.
2 Experimental
The aim of this paper was comparing the AM and the FM screening methods by reproducing the original on the same CTP printing plate and on the same printing sheet. The linearization and the process calibration were carried out before reproduction. The original consisted of a number of test charts with fields was reproduced in the same printing conditions. Reproduced test charts
were enabled the quality control of the prints, according to the prevailing colors and tones on the original. It has classical offset rosette, control fields for CMYK with different coverage, gray tone scales, solid ink patches for CMYK and RGB overprints, and characteristics color photos. Computer generated values from 10% to 100% coverage of the screening elements on the digital printing plates and transfer of these values on the prints were investigated. Mechanical and optical characteristics of the prints were measured and defined, and the visual analysis was made. The device with the CCD camera for measuring the mechanical characteristics and the spectrophotometer for measuring the optical characteristics of screen elements on the prints has been used. The dot gain and the color gamuts have been calculated as the result of the measured values. The visual assessment in the viewing laboratory equipped with the D65 lamp and an interior painted neutral gray was also made
3 Results
A colour gamut is simply a range of colours. For an output device like a printer, it is the entire range of colours that the device can produce (Hunt, 1991). To visualize a printer gamut, the measurements of six colour (CMYRGB) were taken and the results were drawn in the CIE La*b* color space (Fig. 1).
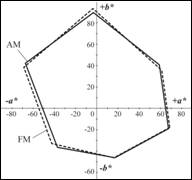
Fig. 1. Color gamuts in CIEL*a*b*diagram.
The results of the measurings were balanced due to the fact that our samples were reproduced using the same system. On the prints reproduced using the AM screening method there is a slight decrease of the cyan and green colours.
The quality of the tone reproduction of the different screening methods has been observed by measuring the mechanical characteristics of the printing elements on the printing plates and
the screening elements on the prints. The results of the greatest aberration are shown in the fig. 2 to 4.
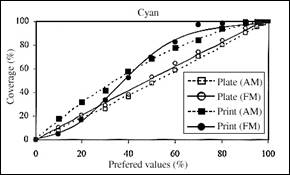
Fig. 2. Coverage on the printing plates and on the prints.
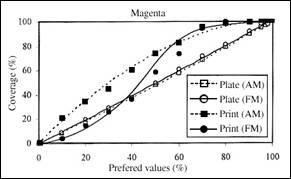
Fig. 3. Coverage on the printing plates and on the prints.
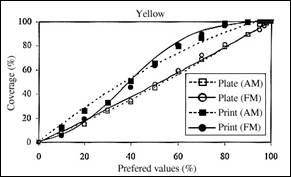
Fig. 4. Coverage on the printing plates and on the prints.
The figures 2, 3 and 4 show that the coverage of the printing plates is balanced in the places of all colours in the both screening systems. In the AM screening method there is a balanced increase of coverage on the measured prints. The prints made by using the FM screening method show the decrease of the coverage on the light tones. These prints also show the increase of coverage
on the midtones as well as significant increase of the coverage on the dark tones.

Fig. 5. Dot Gain at 50% of coverage.
The dot gain has been determined considering the different reproduction of the midtones in both reproduction systems (Fig. 5). The results show that the increase of the coverage is slightly bigger on the prints made by using the FM screening method.
4 Discussion
The results of the measurings of the prints show that with the FM screening system there is a decrease of the coverage on the light tones, which causes poorer clarity and losses on the motives with prevailing light tones. These changes could come as a result of using very small FM screening elements (21 mm) which simply disappear in one of the phases of the reproduction (for example in the plate developing process) or as a result of unbalanced relation between the fountain solution and the ink. These changes will have influence on the reduction of the ink transfer and on the reduction of the surface coverage on the prints. The increase defined on the middle and dark tones in the FM screening system causes more saturated prints as well as quality losses in the reproduction of the dark tones and shadows. The visual assessment brought relatively equal results as the instrumental measuring. The motives with prevailing light tones are of higher quality when reproduced by using the AM screening method. The details on the prints are better expressed with the FM screening method but the quality of the prints with the dark tone motives is significantly lower when compared with the prints made by using the AM screening method. The classical rosette and tone gradations are visible better reproduced by using the FM screening method. It is obvious that FM screening might demand slightly different reproduction curves
5 Conclusion
With the development of the digital technology a new step forward has been made in the screening technologies as well. The reasons? Better quality results, more stable processes and, hopefully, reduced operating costs. These investigations have shown that FM screening method might result with the visually better prints, but the instrumental measurings show that these prints actually need improvements. There fore in order to achieve optimal prints it is necessary to obtain the stability of the system with the usage of the colour management. New screening systems, called transitional screening, which combine different types of screening on different parts of the plate, have been introduced with the aim of achieving the mention objective. Stochastic algorithms are used for the highlight and shadow areas of images, while AM screens are used for the midtones as well as for solid coverage areas (
.
6 References
1 Levien R. (1995). Will this new technology replace halftones in printing?, http://www.wired.com/wired/archive/3.02/geek.html, 2003-15-12
2
3
Hunt R. W. G. (1991).
Measuring Colour, Ellis Horwood Limited, ISBN 0-13-567686-X,
4 Wadle, H. & Blum D. (2002). An Introduction to Screening Technology, http://www.heidelberg.com, 2003-02-17
5 Ward, G. (2003). Computer to Plate - Stars of the thermal screen, http://www.dotprint.com/technology/prepress/ctp/020.shtml