THE INFLUENCE OF OUTPUT DEVICE PROFILE ON LIGHTNESS AND CROMA ON COLOR PRINTS
Strgar Kurečić Maja, Agić Darko, Mandić Lidija
Abstract:
Color management was introduced in color image digital processing to ensure accuracy of color information between different output devices and printed media.
The goal of color management is to reproduce the desired color appearance of an original in a way that is consistently pleasing and acceptable. The system is based on: profiles which describe the devices gamut, conversions from a source profile to a destination profile (gamut mapping), styles of gamut mapping (rendering intent) and software for the conversion (color management module).
In our research we were tested and analyzed the behavior of output device profile
, and found out that in some cases of color image reproduction, use of output device profile does not give the satisfactory results. The aim of this paper was to investigate those special cases and the influence of output device profile on the color reproduction.
Keywords:
color management, device profile, device gamut, image reproduction
1 Introduction
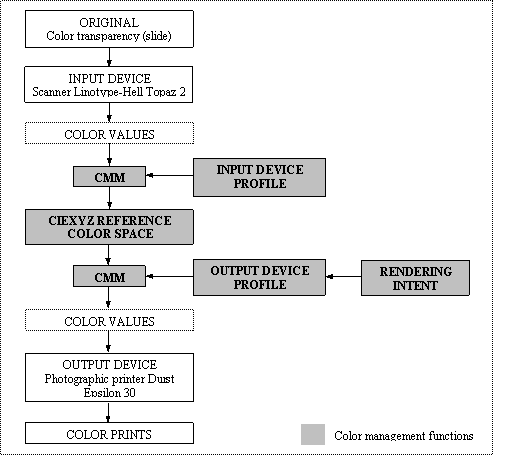
In today’s production environment there are many different sources of color images, including analog and digital cameras and a wide range of scanners. Color images can be reproduced on many different output devices: digital color printers, digital proofing devices, conventional presses or on the Internet. With so many different media and devices it becomes hard to achieve the desired color quality. Controlling the transformations required between different device color spaces, and ensuring that color reproductions are consistent, requires the use of a color management system (CMS). Color management is a collection of utilities and resources for calibration and automating color conversions between all input and output devices within an image processing chain. It is now an established methodology that can give acceptable results in achieving the best available color match between originals, monitor displays and printed output. It gives users a basis for greater control over the reproduction process. The architecture of a color management system incorporates two basic components: profile and color management module (CMM). A device profile defines the characterization of each device used for input and output of color. Devices need to be calibrated to define optimum performance and to maintain it. The second basic component, a color management module, is a digital-signal-processing "engine" for performing the actual processing of image data through profiles. It connects together profiles to produce transformations for any group of devices, using the profile connection space (PCS) as the device-independent standard color space based on the CIEXYZ color space. Metaphorically speaking, the PCS acts as an "adapter" between the profiles of the input and output devices.
2 The image reproduction process
using
CMS
The image reproduction process using color management system (Figure 1.) involves several intermediate steps inserted between the input and output color values:
- The RGB values of the input device are converted into device-independent color values (CIE XYZ or L*a*b*) with the aid of the color profile for the input device and conversation software - CMM.
- When the process for outputting the image has been established, the color values of the image are converted into the process-specific output color values with the aid of the color profile of the output device and the same conversation software (CMM). The output profile contains the desired reproduction strategy, called rendering intent, the way the color management system maps the color of an input image to the color gamut of an output device. There are three types of rendering intent: perceptual (for
images such as photographs), colorimetric (for special colors -
typical example of this is the company logo) and saturation (for so-called "business graphic").
|
|
|
|
|
Figure 1. Image reproduction process using color management
In this paper we are testing and analyzing the behavior of output device profile, so we must describe, in short, how they are created. The first step in creating a printer profile is to print the test target. Printed test target are measured colorimetrically, and the measurement data are entered into the profiling application. After reading in measurement data, there will be options to set up rendering intent, and then the profile is calculated and saved. Information contained in an output profile are:
1.
Device characteristics - characteristic gradation curve and inking (color saturation)
2.
Selected combination of primary colors - gamut
3.
Selected substrate - white point and gloss
4.
Selected type of reproduction - rendering intent
3 Device-independent color spaces
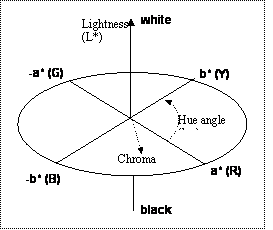
Input devices (scanner, digital camera) cannot read all the colors that the eye can see, and the output devices (monitor, printer, video recorder) cannot reproduce them all. Each device can only read or reproduce a part, or subset, of the range of colors visible to the human eye. This is that particular device's so-called gamut of colors. The color management uses device-independed color space as a connection between input and output devices. Device-independed color spaces are based on the response of the visual system to color, rather than the colorant system of a given device. It is used as a means of converting colors, from one color space to another, mathematically without loss of information. They are known as the absolute color space defined by the CIE, the Commission International de l'Eclairage (International Commission on Illumination). The main ones are: CIEXYZ space (1931) and CIELAB space (1976). The CIELAB color space represents a continual three-dimensional space within which a color can be located and given a numeric value. The lightness axis L* is at right angles to the chromatic plane, whose axis are called a* and b*. In CIELAB, a* represents relative redness-greenness, and b* represents relative yellowness-blueness (Figure 2.). Coordinates for
hue angle (hab) and chroma (C*) can be calculated from the values for a* and b*.
Figure 2. The CIELAB color space
4 Experimental
Color transparences (slides) were scanned with calibrated and characterized (Gretag software Profilemaker) scanner Topaz 2. Ten color images were printed with Durst Epsilon 30 printer device on Fujicolor Glossy Crystal Archive Digital Paper. Printed photos were 13´20 cm large. Images were printed without profile and with profile that manufacturer Durst recommends for this type of paper. For device calibration Durst test target was used (Epsilon Dens Test). Test consists of 21 fields for each of seven colors: cyan (C), magenta (M), yellow (Y), red (R), green (G), blue (B) and black (K). The test target was also printed with and without profile, and measured with densitometer and with spectrophotometer. The photos printed with and without profile where judged by Graphic Arts students.
5 Results
Spectral values of test targets were measured with spectrophotometer Colortron II (with standard illuminant D65) and from this data device gamut was constructed. The measurement data are presented in Table 1. and gamut is shown in Figure 3.
|
color
|
without profile
|
with profile
|
|
L*
|
a*
|
b*
|
L*
|
a*
|
b*
|
|
cyan
|
50,0
|
-39,4
|
-31,3
|
72,3
|
-29,9
|
-14,5
|
|
magenta
|
37,9
|
80,4
|
-51,9
|
54,9
|
60,9
|
-42,8
|
|
yellow
|
74,9
|
9,1
|
89,8
|
80,9
|
-6,5
|
54,1
|
|
red
|
32,8
|
57,6
|
32,3
|
42,5
|
50,2
|
36,7
|
|
green
|
37,5
|
-54,0
|
35,5
|
61,5
|
-40,8
|
29,3
|
|
blue
|
15,3
|
42,4
|
-62,5
|
33,2
|
25,7
|
-56,6
|
Table 1. Measurement colorimetric data

Figure 3. Device gamut with profile and without profile
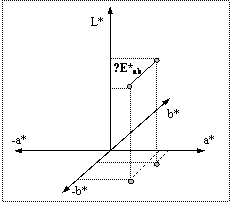
In determine whether a color has been reproduced acceptably, it is useful to quantify the difference between two colors. The CIELAB color space is used as the basis for most color difference systems. Color difference can be defined as the distance in three-dimensional space between the coordinates for two colors. For L*, a* and b*, the differences (∆L*, ∆a*, ∆b*) are defined as the arithmetic difference between the values of the two colors being compared. The total color difference (∆E*ab
) between the two colors in CIELAB is:
∆E*ab
= (∆L*2 + ∆a*2 + ∆b*2)½
Figure 3. Color difference
|
color
|
without profile
|
with profile
|
D
E*
|
|
L*
|
a*
|
b*
|
L*
|
a*
|
b*
|
|
1 red
|
29,7
|
49,5
|
17,8
|
37,4
|
55,3
|
35,2
|
19,8
|
|
2 magenta
|
30,9
|
45,2
|
3,8
|
34,2
|
52,9
|
20,5
|
18,7
|
|
3 gold
|
48,1
|
22,9
|
30,0
|
45,5
|
34,9
|
38,1
|
14,8
|
|
4 violet
|
58,3
|
28,5
|
-25,2
|
54,3
|
42,4
|
-33,8
|
16,8
|
|
5 orange
|
55,6
|
28,1
|
44,7
|
55,1
|
33,3
|
37,6
|
8,8
|
|
6 yellow
|
73,3
|
11,6
|
78,4
|
79,5
|
3,4
|
75,6
|
10,3
|
|
7 cyan
|
50,8
|
-12,5
|
-38,8
|
52,9
|
-33,0
|
-41,0
|
9,6
|
|
8 blue
|
25,8
|
2,4
|
-42,1
|
29,6
|
18,6
|
-55,6
|
21,5
|
Table 2. Measurement data for aberration areas
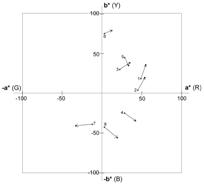
Figure 5. Directions of color error of observed colors
Ten photos printed with and without profile were presented to fifty students in standard viewing conditions. They gave their judgments for contrast, preservation of details, differences in hue and reproduction of shadows. Areas of printed photo where the visual difference was big were measured with spectrophotometer and calculated color difference (E*). Data are presented in Table 2. Perhaps more important than the average color differences are the directions of color error shown as a vector plot at Figure 5. Color errors are presented with numbers correlated with numbers given to the colors in Table 2. Errors whose directions are along lines of constant hue angle correspondent to errors in chroma. In Figure 5. we can see that errors are largely in chroma, but also there are some hue errors.
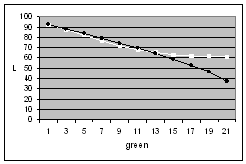
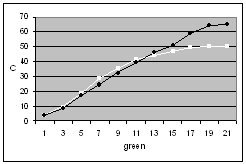
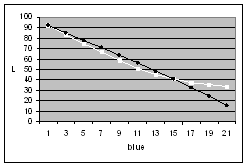
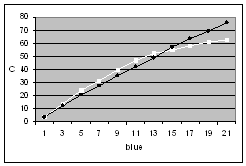
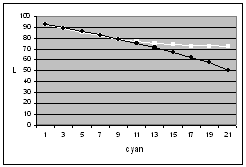
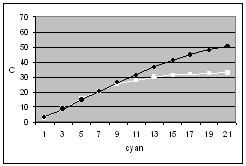
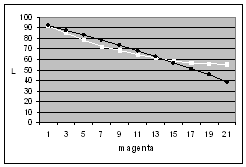
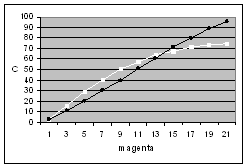
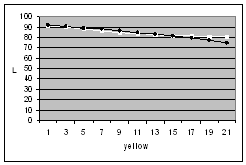
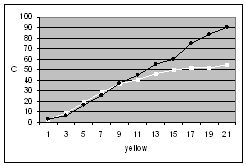
In the following diagrams (Figure 6.), the values for luminance (L) and the values for chroma (C) have been plotted, for every
second step on the test target printed with profile (white squares) and without profile (black dots).
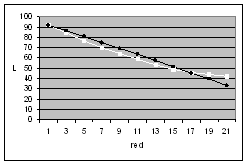
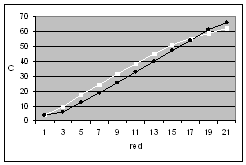
From the diagrams in Figure 6. it is obvious that all colors were lighter (especially in shadow areas) when they were printed with device profile. Lightness differences were largest in green and cyan, and smallest in yellow. The values for chroma (also in shadow areas) were larger on the test target printed without device profile for all colors. Only in highlights and midtones of red and magenta chroma values were larger on the test target printed with device profile.
7 Conclusion
The use of color management shows good results in most common and standard reproduction cases. But there are still some problems in color reproduction from slides (color transparences), where it appears that in wide areas of hues, especially in midtones and shadows, modulations of colors is obvious. Using color management in such cases shows relatively slight differences that depend of the used CMM module, so some prints visually appear better with no use of color management. Compromises in color reproduction are almost always required when reproducing color transparences, because their density range and color gamut often exceed that of the reproduction process. The compromise that harms the least is choosing the compression strategy, or right CMM module, which favors the most important areas of the image and flattens the less important tones. Our further research will be oriented in finding other special cases where the profile doesn't work well. This will be the starting point for algorithm evolution with the goal to improve image processing.
8 References
[1] Berns, Roy S. (2000).
Bellmeyer and Saltzman principles of color technology, Jon Wiley & Sons Inc., ISBN 0-471-19459-X,
New York
[2] Green, P. (1999).
Understanding Digital Color, Pira International, ISBN 1-85802-450-1,
Pittsburg
[3] Mortimer, A. (1998).
Color Reproduction in a Digital Age, Pira International, ISBN 1-85802-278-9,
Surrey
[4] International Color Consortium, ICC Profile Format Specification, Version 3. (http://www.color.org)